Home Mail Articles Supplements Subscriptions Radio
The following article appeared in Left Business Observer #119, July 2009. Copyright 2009, Left Business Observer.
Like this? Subscribe today! There’s a lot more where this comes from—and only some of it makes it to the web for free consumption.
How American awfulness stacks up
Americans may be some of the least healthy people in the rich part of this world, but we sure do feel good about ourselves!
That’s one of the more interesting revelations in the 2009 edition of the OECD’s Social Indicators. Americans lead the world in obesity, lag the world in life expectancy and infant mortality—yet 89% of us report ourselves to be in excellent health, just behind the world’s biggest health-boasters, New Zealanders, who beat us by a point in self-reported health, but who outlive us by more than two years.
This report got some coverage in our surviving newspapers, but most of the stories focused on the not-uninteresting news that the French spend more time than Americans sleeping and eating. But, of course, that shows what layabouts and sensualists they are. What the stories didn’t disclose is that we look like an overworked people with a dim future—aside from being some of the least healthy people in the richer neighborhoods of planet earth.
The general picture of the social and physical health of the U.S. isn’t pretty. In a summary table at the beginning of the volume, countries are rated with a red, yellow, or green symbol, depending on whether they fall in the bottom, middle, or top of the rankings on eight crucial indicators. The U.S. scores a yellow on six (among them employment, reading skills, the gender wage gap, and life expectancy), and a red on two (inequality and infant mortality). But we are near the top in income. Far poorer countries, like Hungary and the Czech Republic, do a lot better than this imperial colossus. Maybe it’s not so bad to have a Commie past.
And not only does the U.S. turn in an awful performance—we’ve been getting worse on six of the eight.
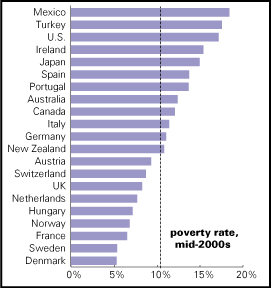
The U.S. always turns in a spectacular performance on poverty indicators, and this version is no exception: not only do we have one of the highest poverty rates in the OECD (as the graph shows), our poor also tend to be quite poor. The average poor household in the U.S. has an income 38% below the poverty line (and poverty is defined here, as it often is in international comparisons, as an income less than half the national household median, with appropriate adjustments made for household size). The average for the OECD is 10 points lower, 28%. It’s in the low 20s in the Scandinavian countries, and in the mid-20s in France and Canada.

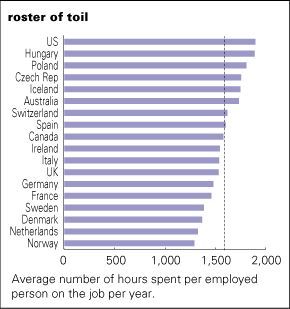
Americans may be poor, but we do work hard. As the nearby graph shows, we work more, and enjoy less leisure (defined simply as time not at work) than the 25 countries for which the OECD has data. Our lead in work is far from trivial—301 hours a year more than the average, or almost nine full workweeks. The reasons are that more of us work, and those of us who do work, work more than people in most other countries. This isn’t really the stuff of which happy and healthy societies are made.
Of course, time spent not working is a loose definition of leisure. One can devote time not spent on the job to all kinds of pursuits, only some of them leisurely. Unpaid work certainly isn’t a form of kicking back, nor are visits to the dentist. The OECD devotes some space to a look at various national time-use surveys, which are typically based on diaries that a large sample of people keep to account for how they spend their days. Based on a stricter definition of leisure, Americans aren’t the easiest living people among the world’s rich countries, but they come off not quite as grimly purposeful as Japanese, Koreans, and Australians—but still less inclined towards chilling than Western Europeans.
But it should be pointed out that time use surveys are pretty problematic. People may lose track of their hours, and/or lie to their diaries—and classifying pursuits isn’t always an easy matter. If you’re listening to music while cooking dinner and supervising a toddler, what exactly are you doing, anyway? Unpaid work, personal care, childcare, or leisure? Different surveys in the U.S. often come up with different results, and comparing surveys across national borders, all built with different techniques and reflecting god knows what cultural differences, seems like a real challenge. The conclusion that Americans spend a helluva lot of time on the job, however, is inescapable.
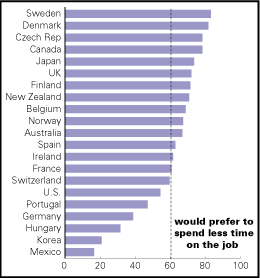
But, strangely, a lot of Americans seem OK with that. Just 54% say they’d like to spend less time on the job, one of the smallest shares in the 21 countries for which the OECD has data. That’s not completely anomalous; there’s actually a slight negative correlation between the length of the work year and wanting to spend less time on the job (that is, there’s a mild tendency for those in countries with long work years to express stronger wishes to work less than do those in countries with shorter work years). Maybe people get what they want, or maybe they just get used to what they’re fed. In the American case, we also profess to like our jobs: 82% of us, in fact, one of the higher scores in the OECD’s sample. And that despite 81% of U.S.’ers saying that high pay is a crucial aspect of a satisfying job, with just 27% saying that condition is met by their own. But we’re a cheerful people; we don’t like to complain. Leave that to the French, when they’re not drinking, eating, and sleeping.
Nor does our future look all that bright here in the USA.
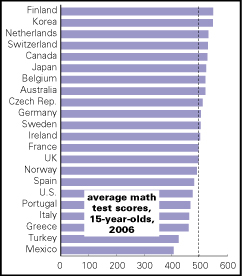
Yes, educational testing can be a debased activity, but despite all these years of “teaching to the test” in the U.S., we’re doing quite poorly on math (reading scores aren’t available). Not only are we drubbed by the usual European suspects, but Korea also leaves us in the dust, and Ireland, not the richest of countries, also holds a significant lead.
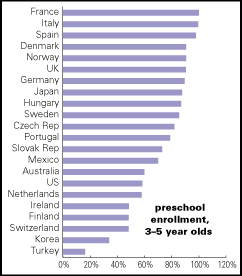
And the successor generation? Not looking so great there, either. Just 58% of our three- to five-year olds are enrolled in formal preschool educational programs, well below the OECD average of 73%—and well behind poorer countries like Mexico (70%), Slovakia (73%), and Hungary (87%). Of course, the Western European countries leave us in the dust: France (100%) and Denmark (91%) aren’t surprises, but Spain (98%), not known as a social democracy, is.
It’s depressing to look too closely at the U.S. health indicators. It’s pretty well known that our headline health figures, like life expectancy and infant mortality, are among the rich world’s worst, and the OECD confirms that impression. Of the 30 countries for which the OECD reports data, the U.S. comes in 24th in life expectancy, with poorer countries behind it. And of the same 30 countries, the U.S.has the sixth-highest incidence of low birthweight among newborns, and the third-highest level of infant mortality; again, it’s mostly poor countries like Mexico and Turkey that have more painful figures.
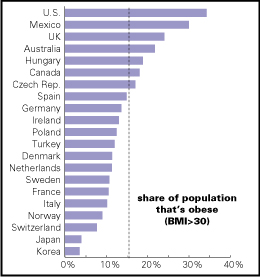
But it’s not just those basics. Americans are the world’s fattest people, which despite the best efforts of the fat acceptance lobby, is not something that comports with a high degree of physical or social health. Though the association isn’t statistically airtight, there is a tendency for countries with high poverty rates to have obese populations; this is certainly true for Mexico and the U.S., if not for Japan or Turkey.
Americans may be champs in the horizontal dimension, but we’re not doing so well on the vertical. The U.S. is about the only country in the OECD in which people in their early 20s aren’t taller than those in their late 40s—a distinction that cannot be explained by the immigration to the U.S. of short people. No, it’s mostly about childhood nutrition, or lack of it.
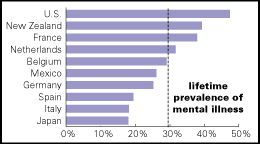
And of the ten countries for which the OECD has data, Americans have the most severe psychological problems, with nearly half experiencing some form of mental illness during their lifetimes—and over a quarter in any given year. Our mental disorders tend to be more severe, as well; though France is pretty high up in the rankings, three times as many disorders are classified as mild rather than severe; the two categories are almost equal in the U.S. And the U.S. leads in all brands of mental problems—anxiety, mood, substance abuse, and impulse control.
Americans profess to be healthy and happy, but by objective evidence, they’re not. Yet what else can a nation of habitual optimists do?
|
All data for graphs on these pages and on p. 1 are from the OECD’s social indicators spreadsheets. To save space, not all countries are shown. Vertical dotted lines represent averages of all countries for which the OECD has data, not just those shown.
|
Home Mail Articles Stats/current Supplements Subscriptions Radio