Home Mail Articles Stats/current Supplements Subscriptions Links
an LBO overview
last update: November 9, 2001
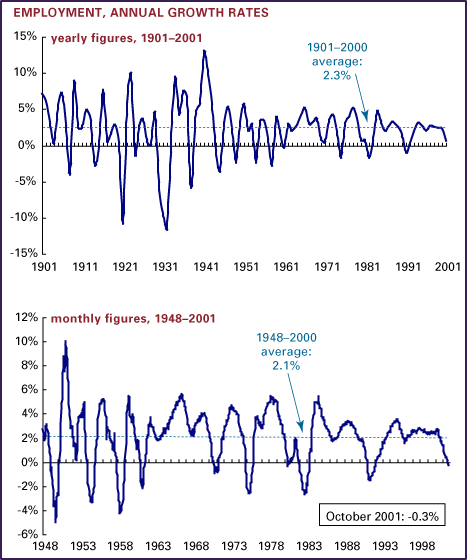
These charts show the growth in employment. Employment growth is a net figure, the difference between new jobs created and old jobs lost. In the U.S., employment is measured by two monthly surveys - one of households, and one of employers (known as the establishment survey - used on this chart except for the early years). The definition is wobbly; in the household survey, you're "employed" if you worked at least an hour for pay in the week covered by the survey; in the establishment survey, anything called a "job," regardless of hours or precariousness of tenure, counts. Still, it's probably the best single measure of the state of "the economy" - both in business cycle terms and in human terms. Employment moves up and down very sensitively with the level of overall economic activity - and employment growth is a good measure of how well ordinary people are doing in the labor market.
This is public domain data massaged by LBO. Please do not reproduce or disseminate without permission.
Adjust your browser window's size on the chart below.

Note that the expansion that began in March 1991 and is now all but officially over wasn't jobless, as it was said in the early 1990s, but it wasn't the gusher its publicists claimed. It did have some duration, but its peaks were below those of past cycles. The recent downturn isn't yet at deep recession levels, but it looks serious enough.
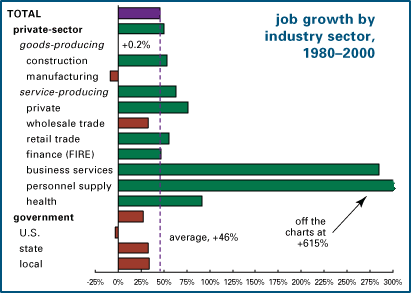
What kind of jobs were created in the booms of the 1980s and
1990s? Here's a chart of job growth by industrial sector since
1980. As the chart shows, the number of manufacturing jobs has
shrunk, as has the number of federal government jobs.  Health
services accounted for about one in six new jobs during the 1980s;
that pace has slowed considerably now that the HMO revolution
is upon us. "Personnel supply" - employment by temp
agencies - has exploded, accounting for 3.5 million out of a total
of 132 million jobs in 2000. This should be put into some perspective,
however, since that's just 2.5% of total employment, and accounts
for one in twelve new jobs since 1980. The broader category of
"contingent" employment - contract, temp, etc. - accounted
for 4% of U.S. employment in February 2001, according to the Bureau
of Labor Statistics. More on this topic can be found in "How
jobless the future," in part a reaction to Stanley Aronowitz
and William DiFazio's The Jobless Future.
Sources: Historical Statistics of the United States, Colonial Times to 1970; U.S. Bureau of Labor Statistics. From 1901-1918, figure is growth in employment as measured by a survey of households; from 1919 onwards, it's based on a survey of employers.
© Copyright 2001, Left Business Observer. All rights reserved.
Home Mail Articles Stats/current Supplements Subscriptions Links