Home
Mail Articles
Stats/current
Supplements
Subscriptions
Links
The following article appeared in Left
Business Observer #92, November 1999. It retains its copyright
and may not be reprinted or redistributed in any form - print,
electronic, facsimile, anything - without the permission of LBO.
Dow 36,000? No, Dow 9,572,460!
Numbers have a reputation for dullness, but you can do the wildest things
with them, especially when they're joined to fantasies of effortless
wealth. Recently we've seen books published with the titles Dow 36,000, Dow
40,000, and Dow
100,000. Curiously, the one with the smallest number is
actually the most fanciful; 40,000 is proposed for 2016, the 100,000
for 2020. Hitting those targets would require performance above
long-term averages, but not outlandishly so. Despite coming in
with the low bid, the authors of Dow 36,000, James Glassman
and Kevin Hassett, say their number would be a fair price today,
though they concede it might take a few years to traverse the
25,350 points necessary to get there.
Before taking apart Glassman and Hassett, a few games of our
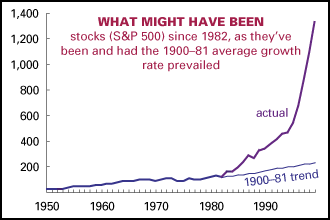
own. Nearby is a graph of what the S&P 500 index would have done since 1982
had it performed according to the average prevailing from 1900
through 1981. (Though less famous than the Dow, the S&P is
the standard benchmark because it's broader -- covering 500 stocks,
rather than the Dow's 30 -- and has a longer history, going back
to 1871, rather than 1896.) That
would translate into a Dow of around 1,795, pretty dull compared
to today's 10,650. But that's looking backward, using standards
from before the New Era of prosperity and joy. Looking forward,
if the stock market were to perform consistently at its vigorous
1982 - 99 standard (over 10% a year after inflation, almost seven
times its 1950 - 82 average, and 18 times its 1900 - 82 average),
the Dow would cross 1,000,000 sometime in 2033, and hit 9,572,460
in 2050. Why ever go to work again?
Back to Glassman and Hassett. Basically, their argument is
that stocks are nowhere near as risky as we've always thought
-- in fact they're safe as U.S. Treasury bonds over the long term.
Actually, since interest rates bob all over the place, Treasury
bond returns are pretty volatile, so that's not as much consolation
as G&H seem to think. But their "discovery," if
true, would have important implications for stock prices. According
to financial theory, the yield on assets should
be proportionate to their risk. Risk is defined in a special way
in this theory: not the likelihood of total loss, but the deviation
in return over time -- the more volatile an asset, the higher
its return should be to compensate for all the bounciness. Typically,
volatility is measured against 90-day Treasury bills as a "riskless"
base instrument, with progressively higher risk premiums tacked
on as you go up the volatility scale. Bonds get riskier as their
maturity gets longer (since the longer the duration, the more
exposure to volatility in market interest rates). Stocks have
historically been considered close to the top of the risk scale,
so their average returns over time have been high.
G&H say this is all wrong -- stocks aren't really that
risky, if you take the long view. Sure the damn things gyrate
all over the place, but over 20 or 40 or 70 years, things even
out. In the long run, we're all whole. This new understanding
of risk -- which ignores the fact that some people might not have
the luxury of waiting several decades to be made whole again --
means that stocks are tremendously underpriced now: They suffer
from an undeserved reputation for risk.
What's the yield of a stock? Conceptually, it's the share of
corporate profits each share represents. But you can't put your
hands on that, so the monetary yield is the dividend plus any
appreciation in the price over time. Unlike interest, which is
fixed for the life of a bond, profits, dividends, and stock prices
tend to grow in line with economic growth over the long term.
Financial theory has developed standard formulas for valuing a share of stock today
given certain assumptions about growth, risk, and interest rates.
G&H take those formulas, plug their trademark assumptions
about the risklessness of owning stocks, and emerge with the conclusion
that a fair price for today's stock market would be 36,000.
A near-quadrupling of stock prices might be lots of fun --
but after that giddy ascent, much of the joy would leave the market.
Their 36,000 figure assumes that the dividend yield on stocks
would be just 0.5% -- well down from today's 1.2%, and way below
the 5.5% average of the last 128 years. And if  stocks truly are as riskless
as bonds, then their long-term yield could sink as low as 2% (dividends
plus price appreciation) a year after correcting for inflation,
compared to the 7% average since 1900.
It's tempting to read Dow 36,000 -- and 40,000 and 100,000
too -- as signs of an advanced collective mania.
A hindrance to indulging that temptation is that there have been
many such signs in recent years, yet the market has rocketed still
higher.
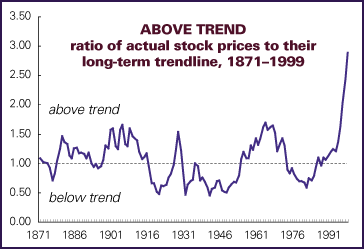
Some perspective is offered by the nearby chart. It's what's
known in the trade as a "detrended" analysis. Yes, stock
prices have risen over time, but with lots of zigs and zags around
the trendline. This chart is the result of stripping away the
uptrend and isolating the zigzags (contact
LBO for details); when the
line is above 1, stock prices are above their long-term trend
line, and when it's below 1, they're below. Normally, stock prices
have wandered between being about 50% above their trendline and
50% below. Sometime in 1996, however, these timid bonds were broken,
and stock prices are now three times their long-term trend price.
Maybe G&H are right,
and all of history has been a timorous preparation for the final
recognition of the risklessness of stocks. Or maybe their book
is a symptom of a euphoria without precedent. Or maybe the Dow
really is on its way to 9,572,460; that makes 36,000 seem modest.
Home Mail
Articles
Stats/current
Supplements
Subscriptions
Links
 That
would translate into a Dow of around 1,795, pretty dull compared
to today's 10,650. But that's looking backward, using standards
from before the New Era of prosperity and joy. Looking forward,
if the stock market were to perform consistently at its vigorous
1982 - 99 standard (over 10% a year after inflation, almost seven
times its 1950 - 82 average, and 18 times its 1900 - 82 average),
the Dow would cross 1,000,000 sometime in 2033, and hit 9,572,460
in 2050. Why ever go to work again?
 stocks truly are as riskless
as bonds, then their long-term yield could sink as low as 2% (dividends
plus price appreciation) a year after correcting for inflation,
compared to the 7% average since 1900.